Thailand's US$56 Billion Digital Economy: How to Read the Numbers Before You Build a Business Case
By ZhongTai Bridge Editorial · Last reviewed October 2026 · 6 min read
Photo: Unsplash
Short answer
Thailand's digital economy is projected to reach US$56 billion in 2025, up 16% from US$49 billion, the second largest in Southeast Asia. Platform e-commerce is growing far faster, at 51.8%, because the two figures measure different things. Match the scope to your business and test your plan against ranges, not a single headline.
What do the headline numbers actually measure?
Executives who search for the size of the Thai opportunity find two numbers that look contradictory. Google, Temasek and Bain & Company's e-Conomy SEA report projects Thailand's digital economy at US$56 billion of gross merchandise value in 2025, up 16% from US$49 billion in 2024, which keeps Thailand second in Southeast Asia. Momentum Works reports that platform e-commerce alone rose 51.8% in 2025 to US$35.5 billion.
Both can be right. The e-Conomy figure covers a broad digital economy that includes e-commerce, online travel, transport and food delivery, and online media, and it is partly a projection made in late 2025. Momentum Works measures sales on e-commerce platforms. Travel, the largest non-commerce component, is projected at roughly US$11 billion and growing only about 6%, which mathematically pulls the blended growth rate down.
A practical rule follows. Whenever you cite a market figure in a board paper, record four things next to it: the scope, the year, the method and whether it is an actual or a projection. If two sources disagree, show both and explain the difference rather than choosing the more attractive one.
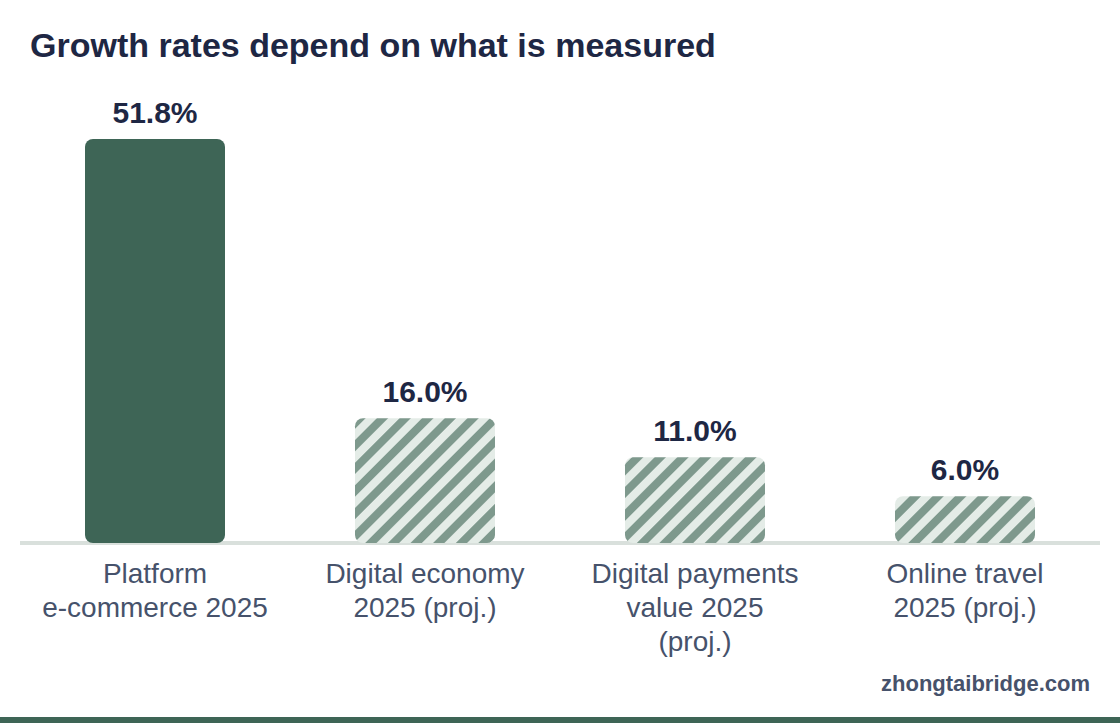
Growth rates depend on what is measured
Column chart. Platform e-commerce 2025: 51.8%; Digital economy 2025 (proj.): 16.0%; Digital payments value 2025 (proj.): 11.0%; Online travel 2025 (proj.): 6.0%
Scopes differ: platforms, the broader digital economy, payment value and travel. Source: Momentum Works; e-Conomy SEA 2025 (Google, Temasek, Bain).
Where is the growth concentrated?
The same e-Conomy research notes that video commerce now accounts for about a quarter of e-commerce GMV across Southeast Asia, and Google Thailand's country manager described the convergence of commerce and content as undeniable. Momentum Works adds that TikTok Shop more than doubled its regional GMV in 2025 and is closing the gap with Shopee.
The implication is that growth sits where entertainment and purchase meet, not in the maturing parts of the digital economy. For a company planning market entry, this changes the capability list. Creative production, creator relationships, live selling and fast catalog turnover become as important as traditional search and listing optimization.
What e-Conomy SEA projects for Thailand in 2025
US$56B
digital economy GMV, +16%
US$11B
online travel GMV, +6%
US$163B
digital payments value, +11%
25%
of regional e-commerce is video commerce
Source: e-Conomy SEA 2025.
What does the payments and consumer context say?
The e-Conomy projections also point to a deep financial layer: digital payments in Thailand are expected to reach a gross transaction value of about US$163 billion in 2025, growing 11%. Checkout friction is therefore low, and consumers are comfortable paying digitally.
Coverage of the same report cites headwinds as well, namely sluggish domestic consumption and high household debt. Growth is real, but it coexists with cautious spending. For pricing and promotion strategy, this suggests that value-for-money positioning and campaign-day discipline will matter more than brand premium for most new entrants.
DataReportal's figures complete the picture: 67.8 million internet users and 56.6 million social media user identities in October 2025, with LINE reaching about 56 million monthly users. Reach is not the constraint. Attention, trust and unit economics are.
How do you convert market data into a business case?
Use two methods and compare them. A top-down view starts from market size and narrows it through category, segment and achievable share. Our market size estimator on this site applies that logic to the US$35.5 billion platform base and shows a sensitivity table, so you can see how much the answer depends on one assumption.
A bottom-up view starts from your own funnel. Estimate monthly store or listing views, multiply by conversion rate and average order value, and apply your contribution margin from the landed cost calculator. For illustration only: 100,000 monthly views at a 2% conversion rate and a US$20 order value produce US$40,000 of monthly revenue, and at a 15% contribution margin about US$6,000 of monthly contribution before fixed costs. Change any input by a third and the conclusion can flip.
Where the two methods differ by more than a factor of two, do not average them. Investigate. The gap usually reveals a hidden assumption, such as an unrealistic share of voice or a conversion rate borrowed from a mature market.
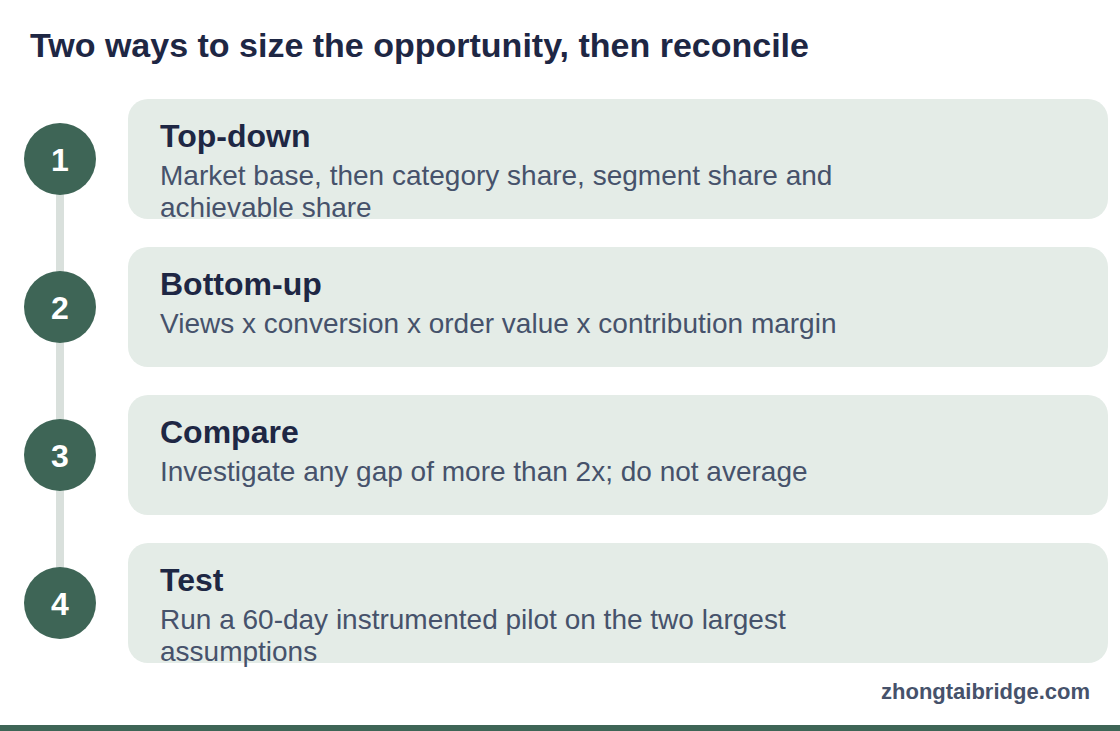
Two ways to size the opportunity, then reconcile
Process diagram. 1. Top-down: Market base, then category share, segment share and achievable share. 2. Bottom-up: Views x conversion x order value x contribution margin. 3. Compare: Investigate any gap of more than 2x; do not average. 4. Test: Run a 60-day instrumented pilot on the two largest assumptions.
Five questions a board should ask before approving entry
Which definition of the market are we using, and does it match the channels we will actually sell through?
How much of the projected growth sits in categories and formats where we have a right to win?
What conversion rate and advertising cost per order are we assuming, and where did those numbers come from?
What is our break-even return on ad spend, and how far is it from what comparable sellers achieve?
Which assumption, if wrong by a third, would change our decision, and how will we test it cheaply in the first 60 days?
Where is the data thin?
Three gaps recur. First, category-level data is scarce: public reports describe platforms and sectors, not whether your specific product will sell. Second, margins and customer acquisition costs are rarely published, so you need pilots or expert interviews. Third, repeat purchase and lifetime value are poorly documented outside large platforms.
These gaps explain why serious entrants commission primary research in Thai and validate with small, instrumented tests before committing inventory. The market is large enough to reward preparation, and competitive enough to punish guesswork.
What should you do next?
Define the market scope in one sentence and attach sources to every figure in your business case.
Run both a top-down and a bottom-up estimate and reconcile the gap.
Identify the two assumptions that matter most and design a 60-day test for each.
Decide in advance which results would make you proceed, adjust or stop.
How should you present market data in a board paper?
Executives distrust headline numbers that arrive without scope. A board paper on Thailand should carry a one-page evidence table with five columns: the figure, the source, the year, the scope and the status as an actual or a projection. Place the platform e-commerce figure next to the digital economy figure and explain why they differ, so the reader sees that growth of 51.8% and growth of 16% describe different pools. Then show the number your plan actually depends on, for example the category within platform e-commerce that you will sell in, not the largest number available.
Evidence table template for a board paper
Figure
Source
Year and status
Scope
US$35.5B, +51.8%
Momentum Works
2025, reported
Platform e-commerce GMV
US$56B, +16%
e-Conomy SEA
2025, projection
Digital economy incl. travel, transport, food, media
67.8M
DataReportal
Oct 2025, reported
Internet users
Your category share
Your research
Date of analysis
Your channels only
Close with a range, not a point. Show low, base and high revenue for year one and the assumptions behind each, so the board approves a hypothesis with explicit tests rather than a forecast that will be wrong by definition.
Frequently asked questions
Is Thailand really the second-largest digital economy in Southeast Asia?
According to the e-Conomy SEA 2025 report, yes, with a projected US$56 billion of GMV in 2025. Projections are revised when actuals are published, so check the latest edition.
Why do growth rates differ so much between reports?
They measure different scopes. e-Conomy SEA covers a broad digital economy including travel and media, while Momentum Works measures platform e-commerce sales.
Which figure should I use in a business case?
Use the one that matches your channels, show the alternative next to it, and test your plan against a range.
What is the most defensible number to use for a consumer product?
The one that matches your channel and category, shown beside the broader market figure with an explanation of scope.
Thailand taxed low-value imports with VAT from February 2025 and duty from 1 baht on 1 January 2026. What changes for Chinese sellers and how to respond.