Thailand Digital Market 2026: Key Statistics for Chinese Businesses
By ZhongTai Bridge Editorial · Last reviewed October 2026 · 9 min read
Photo: Unsplash
Short answer
Thailand had 67.8 million internet users and 56.6 million social media identities in October 2025. LINE reaches about 56 million monthly users, over eight in ten internet users use TikTok monthly, PromptPay has more than 81 million registrations, and platform e-commerce grew 51.8% to US$35.5 billion in 2025.
How many Thais are online?
Thailand's digital base
67.8M
internet users (Oct 2025), up 2.4M or 3.7%
56.6M
social media user identities, 79.1% of population
96.6M
mobile connections, 135% of population
2h 35m
average daily time on social platforms
Source: DataReportal, Digital 2026: Thailand.
Population base matters. DataReportal uses a UN-based population of 71.6 million, while the registered population was 65.8 million at the end of 2025, so penetration percentages differ by base. State which one you use.
Which platforms reach the most users?
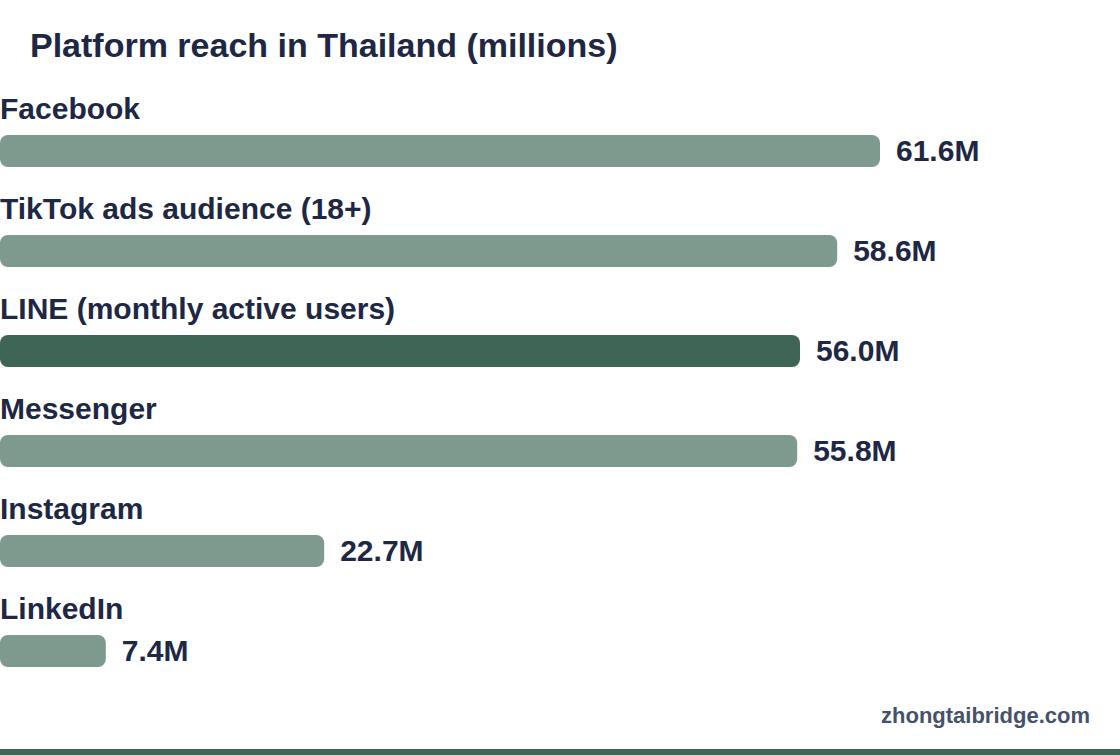
Platform reach in Thailand (millions)
Horizontal bar chart. Facebook: 61.6M; TikTok ads audience (18+): 58.6M; LINE (monthly active users): 56.0M; Messenger: 55.8M; Instagram: 22.7M; LinkedIn: 7.4M
Advertising-reach and monthly-user figures from different sources; do not add them or treat them as unique people. Source: NapoleonCat (May 2026); DataReportal; TikTok Ads Manager estimate.
TikTok deserves emphasis. According to We Are Social's July 2025 report, Thailand has the world's second-highest share of internet users who are monthly TikTok users, above eight in ten, compared with about three in ten globally. Thailand is also among the largest ad-audience markets for the platform.
How big is Thai e-commerce?
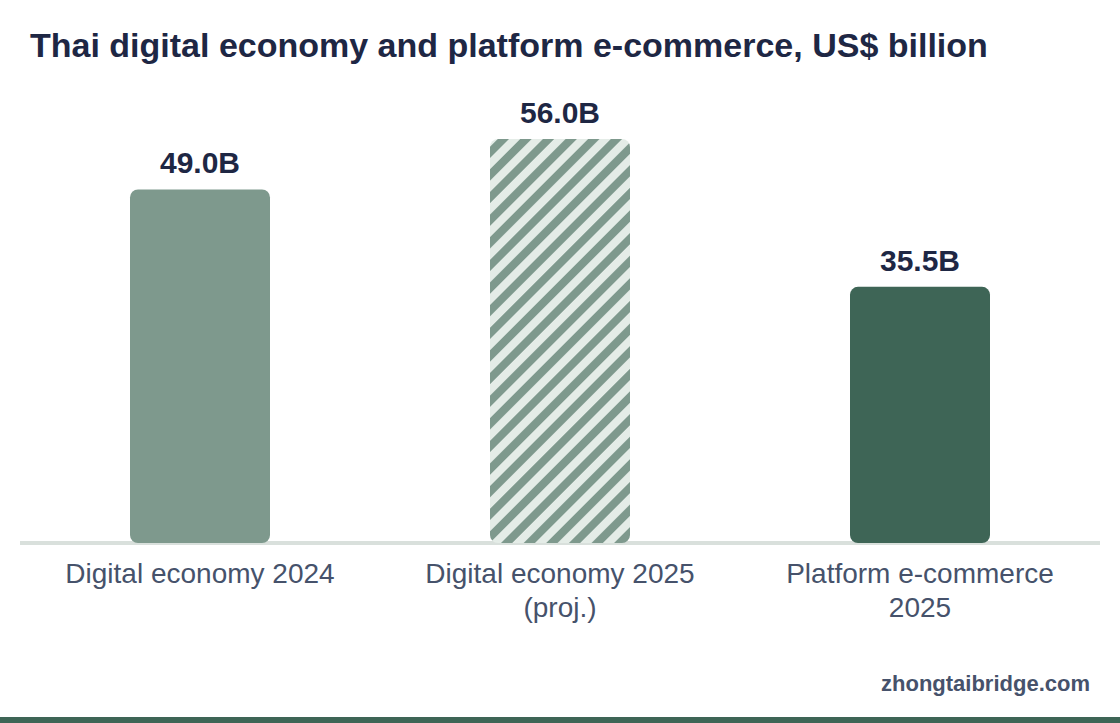
Thai digital economy and platform e-commerce, US$ billion
Column chart. Digital economy 2024: 49.0B; Digital economy 2025 (proj.): 56.0B; Platform e-commerce 2025: 35.5B
Different scopes: the digital economy includes travel, transport, food delivery and media. Source: e-Conomy SEA 2025; Momentum Works.
Momentum Works reports 51.8% growth in platform e-commerce in 2025, led by Shopee, with TikTok Shop the fastest-growing platform. The e-Conomy SEA research projects 16% growth for the broader digital economy, partly because travel, at about US$11 billion, grows more slowly. Video commerce accounts for about a quarter of regional e-commerce value.
How do Thais pay?
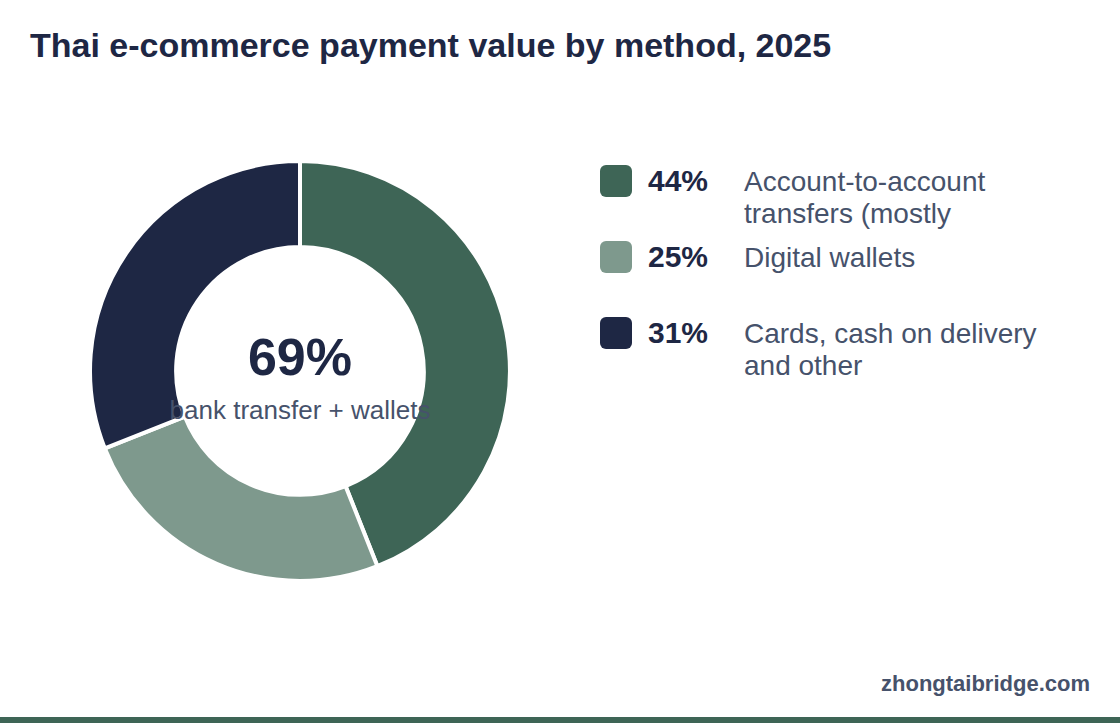
Thai e-commerce payment value by method, 2025
Donut chart. Account-to-account transfers (mostly PromptPay): 44%; Digital wallets: 25%; Cards, cash on delivery and other: 31%
The third segment is the remainder after the two reported shares. Source: Worldpay data via Antom; Tazapay.
PromptPay had more than 81 million registrations in March 2025 and processed 2.16 billion transactions worth THB 4.2 trillion in September 2025, according to figures reported by payment providers. About 61.5% of the population used QR codes monthly in 2024. Cards remain important for international purchases, travel and premium goods.
What about Chinese investment in Thailand?
Between January and September 2025, Singapore, Hong Kong and China were the top three sources of foreign investment applications by value to the Board of Investment, with China at THB 142.9 billion. Applications measure intent, and Singapore's position partly reflects its role as a gateway for Chinese and American firms.
What do these numbers mean for Chinese brands?
Chat is the conversion channel: plan for LINE and Messenger, not only websites.
Video is a primary discovery surface: TikTok's reach is among the highest in the world.
Checkout must support PromptPay and wallets.
Marketplaces are the fastest route to demand, with TikTok Shop adding content-led sales.
Growth attracts competition, so search terms and attention are becoming more expensive.
How to use these statistics in planning
Use statistics to frame questions, then answer them with your own data. Reach figures help you decide where to be present, not how many customers you will win. Payment data tells you what to put at checkout. E-commerce growth rates tell you where competition is heating up. For a launch plan, build a one-page fact base with five numbers that drive your decisions, each with a source and year, and review it every quarter.
A one-page fact base for a Thailand launch
Decision
Number to track
Why it matters
Channel mix
Platform reach and e-commerce growth
Where audiences and competitors are
Checkout design
Share of transfers and wallets in e-commerce
Payment methods to support
Content plan
TikTok and YouTube usage, time on social
Format and volume of content
Service plan
LINE and Messenger reach
Chat capacity and tone
Forecast base
Registered vs UN-based population
Per-capita models
Limits of public statistics
Public data rarely tells you about your category's margins, repeat purchase or acquisition costs. It also arrives with a lag: the digital reports used here reflect data from October 2025, and several investment numbers cover 2025. Treat them as a map of the terrain. The route depends on tests with your own product, price and message.
Executive questions on using Thai market statistics
Which single number best describes the Thai opportunity? No single number does. Combine reach, payment adoption and e-commerce growth, and attach your own conversion and margin assumptions.
Can we compare Thailand with Indonesia or Vietnam using these figures? Only with matching definitions. Momentum Works reports Thailand's platform GMV growth of 51.8% and Indonesia's of 2.2% on the same basis, but reach figures from other sources may not be comparable.
How often do these numbers change? Annual reports update once a year, while platform ad reach changes monthly. Record the date next to each figure.
Where do analysts disagree? On scope and definitions: digital economy versus platform e-commerce, registered versus UN-based population and accounts versus unique people.
A data dictionary: what each metric measures
Statistics fail executives when definitions are blurred. Internet users measure people with access; social media user identities measure accounts, which can exceed unique people; advertising reach measures accounts a platform can show ads to; monthly active users measure activity on an app; GMV measures the value of goods sold on platforms, usually before refunds and sometimes including tax and shipping; GTV measures payment value. Treat each as a different instrument. Use reach to plan content, activity to plan service, GMV to size marketplace opportunity and payment value to understand infrastructure.
Data dictionary for Thai market metrics
Metric
What it counts
Use it for
Do not use it for
Internet users
People online
Audience potential
Sales forecast
Social media user identities
Accounts, not unique people
Channel planning
Counting customers
Advertising reach
Accounts platforms can reach
Media planning
Unique audience size
Monthly active users
Active app users
Service channels
Revenue
GMV
Value of goods sold on platforms
Market size
Your profit
Payment value (GTV)
Value of payments
Payment infrastructure
E-commerce size
Add a date and a source to every figure, and refresh the dictionary each quarter as new editions appear.
Seven charts every Thailand board paper should include
Audience reach by platform, with the caveat on overlap.
Platform e-commerce growth versus other Southeast Asian markets.
Payment method share of e-commerce value.
Search share, showing Google's dominance.
Household debt trend and its interpretation.
Competitor price ladder in your category.
Your own funnel: views, conversion, margin and return on ad spend.
Building a Thailand market dashboard in a day
A dashboard turns statistics into a habit. Create one sheet with five tabs: audience (internet users, social identities, platform reach), commerce (platform GMV growth, payment mix, campaign calendar), search (Google share and your keyword clusters), economy (household debt, VAT and duty status) and your funnel (views, conversion, cost per order, margin). For each metric record the value, the date, the source and the next update date. Add a column for what decision the metric informs. Review it monthly with the team and replace stale figures when new editions appear.
Dashboard tabs and refresh rhythm
Tab
Key metrics
Refresh
Audience
Internet users, social identities, platform reach
Annual and quarterly
Commerce
Platform GMV growth, payment mix, sale days
Annual and monthly
Search
Google share, keyword impressions, AI citations
Monthly
Economy
Household debt, VAT and duty status
Quarterly
Funnel
Conversion, cost per order, margin, rating
Weekly
Reading growth rates responsibly
A growth rate describes change relative to a base and depends on scope and period. Thailand's platform e-commerce grew 51.8% in 2025, and the broader digital economy is projected to grow 16%, while Indonesia's platform e-commerce grew only 2.2% and the region's grew 22.8%. These numbers describe different pools, and none predicts your own growth. Before you use a growth rate in a plan, ask what it measures, whether it is an actual or a projection, what the base year was, and how it would change if one large player were removed. A fast growth rate from a small base can mislead, while a mature base with modest growth may still offer large absolute opportunity.
Use ranges when you plan. A prudent business case uses a conservative growth rate for market growth and tests the plan at zero growth, so that it does not rely on a tailwind that may not last.
Using population and payment data in operations
Operational decisions benefit from the same data. Payment mix tells you which checkout options to prioritize. Mobile connections at 96.6 million, equal to 135% of the population, tell you to test every page on a phone. LINE reach tells you where to place customer service. Registered population of 65.8 million, versus a UN-based estimate of 71.6 million, tells you to note which base each per-capita metric uses. Build these choices into your launch checklist so that the statistics shape the product, not only the slide deck.
What the data can and cannot answer
Questions and their evidence
Question
Can statistics answer it?
What else you need
How many people are online?
Yes
Registered versus UN-based population note
Which platforms reach my audience?
Partly
Your own audience insight and tests
Will my product sell?
No
Category research and a pilot
How much will I earn per order?
No
Your landed cost and fees
Is the market growing?
Yes, with scope caveats
Your own funnel data
Which price will win?
No
Competitor audit and price tests
The point is to prevent statistics from substituting for decisions. Use them to frame the opportunity, and use tests to prove it.
A worked example: sizing a pilot from the numbers
The example is illustrative. A brand targets a niche that represents 2% of platform e-commerce. Starting from US$35.5 billion, the niche is about US$710 million. The brand assumes that its target segment is 20% of the niche, or US$142 million, and that it can win 0.05% in the first year, or about US$71,000, equal to roughly 2,400 orders at an average order value of US$30. That is roughly 200 orders a month. Using a 2% conversion rate, this implies about 10,000 visits a month, and with a cost per visit of US$0.10, advertising of about US$1,000. The numbers are small, which is the point: they define a pilot that can be tested, and they reveal that conversion, cost per visit and order value matter more than market size.
Change any input and recalculate with the market size estimator, then decide which assumption to test first.
Grading sources by reliability
High: official statistics, central bank and regulator releases, audited company reports.
Medium: well-documented industry reports with published methods, such as Momentum Works and e-Conomy SEA, and audience tools such as DataReportal.
Lower: single-source blogs, vendor marketing pages and aggregated summaries without methods.
Always check the date, scope and whether the figure is an actual or a projection.
Pitfalls when quoting statistics to headquarters
Chinese headquarters often compare Thailand with China or with other Southeast Asian markets. Avoid three pitfalls. First, do not compare reach figures across countries without checking that definitions match, because platform categories and counting methods differ. Second, do not present a regional share as a Thai share: the 98.8% share held by three platforms is a regional figure for 2025. Third, do not mix years: October 2025 audience data and 2025 e-commerce value are not the same period as a 2026 budget. Add a footnote with scope, year and source to every figure, and keep a list of the figures you plan to update when new editions appear.
Using this page in your own materials
You may quote the figures on this page with attribution to the original sources, which are linked at the end of the article. Do not cite this page as the source of the data. Check each source for later editions before you publish, and record the date you accessed it. If you present figures to a board, include the scope and year in the footnote, and show ranges where sources disagree. If you need a figure that is not here, tell us and we will research it, or ask us to build a custom data pack for your category.
Frequently asked questions
How current are these statistics?
They reflect reports published in 2025 and 2026. Check each linked source for later editions before using the figures in a board paper.
Why do reports disagree on e-commerce growth?
They measure different scopes. Momentum Works tracks platform e-commerce sales, while e-Conomy SEA covers a wider digital economy including travel and media.
Where can I find the original data?
See the sources list at the end of this article.
Can I add platform user numbers together?
No. They come from different methods and overlap heavily. Use them to compare relative reach.
A practical Thailand market research method: the four lenses, reliable data sources, Thai-language techniques, survey design, report structure and mistakes to avoid.
Seven evidence-based patterns in how Thai consumers discover, evaluate and pay, using data on TikTok, LINE, PromptPay, campaign days and academic studies.
A six-stage guide for Chinese companies entering Thailand, with 2026 market data, a China-to-Thailand translation table, a 90-day plan and a launch checklist.